
It’s a common criticism from many politicians and activists: Manchester spends less money per student than any other district in the state of New Hampshire except for one (159th out of 160). This is mostly true but it doesn’t matter because it’s like comparing apples and oranges. Manchester should spend less than any other district because it is the largest and can be far more efficient and leverages buying power and economies of scale that smaller communities can’t begin to touch.
TL;DR (Too long; didn’t read)
When you compare Manchester to other cities that are the same size and demographically similar, we spend more per pupil than they do. In fact, we spend more than the national average. And a 2017 audit of the Community College System of New Hampshire (CCSNH) observed that the costs in rural colleges were much higher than urban colleges and they were struggling to evenly allocate state funds.
Conclusion: Manchester’s per-pupil spending is above average nationally and compared to similar cities, largely due to economies of scale enjoyed by urban schools.
Comparing Apples to Apples
Instead of comparing Manchester to a bunch of tiny towns, with which we share zero demographically, how about we compare ourselves to other cities with the same population? I’ll share some stats that are a much fairer comparison (from bestplaces.net). However, they’re still not fair because these other states have much higher per-capita tax revenues. Yet, we spend more per student than any of them except Lowell, MA (2015 numbers).
Incidentally, the national average is $12,435.
Here are some comparisions:
Elgin, IL
Per-pupil Spending: $11,791
Student/Teacher Ratio: 21.8
Population: 109,513
Median Home: $134,900
West Jordan, UT
Per-pupil Spending: $7,691
Student/Teacher Ratio: 22.7
Population: 103,846
Median Home: $212,300
Clearwater, FL
Per-pupil Spending: $10,276
Student/Teacher Ratio: 17.1
Population: 108,138
Median Home: $141,200
Manchester, NH
Per-pupil Spending: $12,761
Student/Teacher Ratio: 14.6
Population: 109,786
Median Home: $178,500
Lowell, MA
Per-pupil Spending: $17,343
Student/Teacher Ratio: 12.6
Population: 106,739
Median Home: $200,200
Gresham, OR
Per-pupil Spending: $11,842
Student/Teacher Ratio: 21.1
Population: 105,612
Median Home: $214,900
Economies of Scale
A 2017 audit of the Community College System of New Hampshire (CCSNH) concluded the following:
CCSNH did not have a methodology for how to allocate State funding to the seven community colleges and the Chancellor’s Office. Instead, each institution received a similar proportion of State funds to what they received the prior year, with some small variation. There were no requirements in CCSNH policies and procedures for how to allocate State funding to the community colleges. A manager said CCSNH continues to use the current funding approach because “this is how things have been done” in the past.
The following table illustrates the funding disparity:
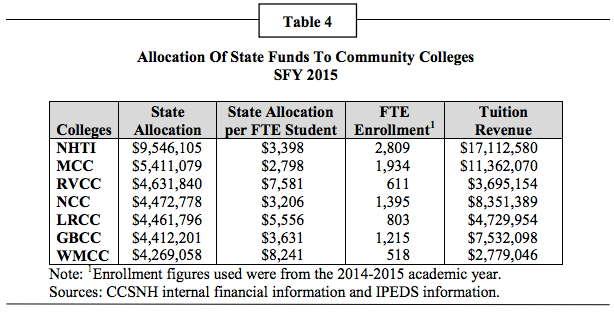
CCSNH responded as follows:
As the auditors note in this observation, “An internal debate regarding how to effectively allocate State funding had developed among CCSNH managers.” Presently state funds appropriated to CCSNH are allocated to the colleges based primarily on the proportion allocated in prior years. We are actively discussing a new methodology for allocating this funding, but are sensitive to any change which would be experienced as a loss by a college or colleges. It is true as the auditors note that our smaller, rural colleges receive a (proportionately larger) share of state funding that does not strictly conform to the proportion of enrolled students. This is an inevitable function of differences in economies of scale larger colleges are able to realize, and the financial challenges smaller and more rural colleges face in serving the needs of a population that is both more dispersed and, typically, more economically challenged, and in regions that do not have as strong an industry support base as other regions of NH.
This supports the assertion that it makes sense that Manchester would be able to spend substantially less money for the same services as smaller communities. Furthermore, the numbers cited by the state DoE do not include significant budget line items like transportation, debt service, grants, and public/private partnerships. These are all significantly higher in Manchester than surrounding towns.
It’s fair to have a debate about how much Manchester should be spending to educate our children. But a fair and balanced discussion would keep in mind that:
- It is not meaningful to compare Manchester to other towns in NH. It is a unique city.
- When compared to other similar cities, Manchester spending is above-average.
- Spending in Manchester has increased by every, single measure over the past 10 years.